Last month I saw a puzzle posted on fivethirtyeight.com about poker hand probabilities and, like with many things these days, wondered how I could solve it with PowerBI. I had been curious to learn more about the M list functions, and this seemed like a good application. I didn’t finish until well after the deadline but did end up going way down the rabbit hole so thought I’d share what I did/learned. This post describes how one can generate every possible combination of five cards (2,598,960 rows) and seven cards (133,784,560 rows) entirely from scratch (i.e., no “Get Data” step). For the latter, there are 21 ways to pull 5 cards from 7 and to score it all in DAX we need each card on its row, resulting in a table with >14 billion rows! While Power BI can handle that many rows, my computer (and hence my calendar) could not, so a way to reduce the data up to 700 fold is also described. In Part 2 of this post, we’ll then use DAX to score all the possible hands generated below and do some analytics.
For this post, we’ll use Texas Hold ‘Em as the seven-card game, which means we need a deck of cards, a table for the two cards held by each player, and another for the five cards shared by all players. These two are then combined to make all the seven-card combinations. For each of the Two, Five, and Seven tables described below, the expected number of rows can be calculated using the same equation (i.e., 52!/((52-n)!*n!), where n is the number of cards. Fortunately for us, the order of the cards doesn’t matter for what we are doing, so as we build it we’ll be able to eliminate hands with the same cards in different orders. Of course, the order the cards come out makes all the difference while playing poker, so this model isn’t helpful to experienced poker players.
You can download the reduced size version of the file to follow along with here
Deck of Cards
In M, lists are the things inside curly brackets, and one could quickly make a list with 14 billion values with one line – {1..14,000,000,000}, but that isn’t very useful. Instead, we begin building our deck of cards with a much shorter list – {2..14}, representing cards 2 through 10, J, Q, K, A. We convert that to a table with the menu button in power query and add a custom column with another list for the four suits – ={“C”, “D”, “H”, “S”}. We expand that list to make the cross join of ranks and suits and a deck of 52 cards. To simplify things later for both M and DAX functions, the rank is prefixed with a “.” (for example, the two of clubs shows as “.2C”). The “.” can easily be removed later with Replace Values, but avoids errors in the search/find M and DAX functions we’ll end up using (e.g., “12C” contains “2C,” but “.12C” does not contain “.2C”).
Two Cards Table
The query to make the table of two cards combos starts with a reference to the Deck query (“=Deck”) and then we simply add a custom column that also references the Deck query, and expand it as new rows (52 X 52 rows). If these two columns are named “C1” and “C2”, we can now make a new list in a third custom column called “TwoList” with “={[C1], [C2]}”. Because we can’t be dealt the same card twice and because the order of cards doesn’t matter, we can clean this up some with the following steps using a couple of the M List Functions:
- Sort the TwoList above with “=List.Sort([TwoList])”
- Remove duplicates from that column (yes, remove duplicates works on lists too)
- Use “=List.Distinct([TwoList])” to find the distinct count of cards in the list
- Filter out (remove) the rows where the distinct count is 1
- Add an Index column (“TwoIndex”) to be used for relationships/filtering
The above results in a table with the expected 1326 rows – 52!/(50!*2!).
Five Cards Table
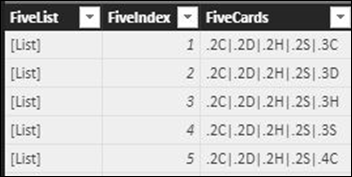
Start with a reference to the Deck query and add four more custom columns each referencing the Deck query, expanding each one as you go. Again eliminate duplicate lists and lists containing duplicate cards with the same steps above. In practice, as this table gets fast quickly, I also repeated those steps after 4 cards were added to reduce the number of rows sooner. We create another sorted list with “=List.Sort({[C1], [C2],[C3],[C4],[C5]})”. Then we remove the card columns, add an index, duplicate the list column, and extract values from the duplicate. This gives us a table like below with the expected number of rows (2,598,960).
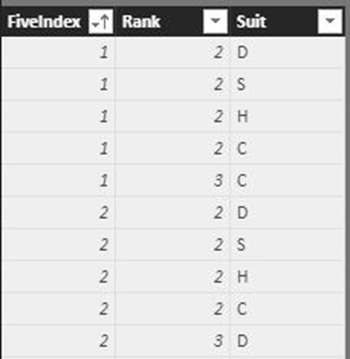
In Part 2 we’ll use DAX to score each hand, but DAX doesn’t have list functions, so we need to create another table (“FiveExp”) in which we expand each card to its row. To do this, we start with a reference to the Five query (note how all the queries feed off the Deck query ultimately, so you can downsize the model easily for storage/troubleshooting by just changing the initial lists used to make the deck). We then expand the FiveList to new rows and split that column at the rightmost character into “Rank” and “Suit” columns that we’ll use for DAX analyses. The resulting FiveExp table looks as follows:
Seven Cards Table
For this one, we start with a reference to the Two table, remove all but the “TwoIndex” and “TwoList” columns, and add the “FiveIndex” and “FiveList” columns from the Five table. We can then combine the two next steps by nesting two list functions, creating the sorted list of seven cards as follows:
=List.Sort(List.Combine([TwoList], [FiveList]))
From here we again remove duplicate lists and lists with duplicates (and add an index) to get the expected number of rows (133,784,560 rows). It’s easy to type this all out, but by now these queries are getting very slow to load (many rows with many transformation steps). Fortunately, as the standard deck of playing cards hasn’t changed in a while, we’ll probably never have to refresh the data.
Not done yet … still need to do DAX later, so we need to create all the ways to pull 5 cards from 7 (21 ways to do that, so #rows x 21) and expand each card to a new row (rows x 5), so we can score each one and find the max (best possible hand).
Scoring Table
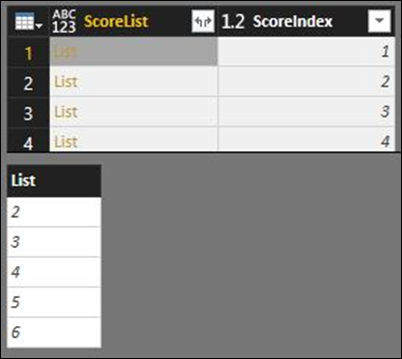
We are going to use a second list to extract the 5 cards from the list of 7. Items in a list are indexed starting from zero, so we need a table of lists of all the possible 5 index combinations from the list of the first seven index values ({0..6}). Like with the Two table, we create every combination of “0” to “6” and make a list from them. We then add the {0..6} list again and use the List.Difference() function to remove the two values in the “TwoLeaveOut” list from those in the “List0to6Index” list. Below is a what the query looks like at this point, with an example difference list shown (first two index values removed). We then add an index column (“ScoringIndex”) and keep it and just the “ScoringList” column.
SevenExp Table
For our last and biggest table, we start with a reference to the Seven table and remove all but the index and list columns. We then add a column with the Scoring table and expand it (133M rows X 21!). Now we use the List.Transform() function, which is probably the most powerful/versatile of the list functions. To reference an individual value in a list, you can use the following syntax – {List}{indexposition}, we can pull the five index positions from a list of seven with the following M code in the Add Custom Column popup:
=let
templist=[SevenList]
in
List.Transform([ScoreList], each templist{_})
//the “_” is where “each” of the index list values goes when it’s their turn
In the above, we first create a variable out of SevenList (so we can reference it inside the List.Transform(), which iterates through each of the ScoreList values (the 5 index values), extracting that index position from variable “templist,” and places them all in a new list. One can do simple transforms or complex formulae, which is what makes List.Transform() so powerful. Thanks to one of Imke’s posts to show me that one.
For the final step, we extract the new lists of 5 cards into rows, resulting in a table with >14 billion rows!!
To be honest, I never did hit that button on the Wonkavator (did not load the full SevenExp table); I didn’t have time to wait, and my computer could not handle the DAX expressions (see Part 2) on such big tables even if I did. At first, I thought I’d let the cloud do the work and publish it to PowerBI.com, but we can’t modify the query on the cloud (and I couldn’t publish w/o first loading the queries). I also tried replacing the initial {2..14} in the Deck query with a Sharepoint Online list with those values that I could make small ({2..5}) for my computer to refresh and then publish, change the SP list, and let it auto-refresh. However, the cloud timed out. I even set up a virtual machine with my free Azure trial to no avail. Note: Once you’ve set up a VM, it’s time to consider that data has become more than a hobby. Fortunately, I was able to come up with a way to reduce the dataset significantly, avoiding all that extra processing and file size. Note: the “Seven_Full” and “SevenExp_Full” are in the provided file, but I added a Keep Rows step to keep it small, instead of disabling load (this keeps my relationships and calculated columns intact, and avoids measure errors).
Reduced Dataset
When scoring poker hands, the suit only matters for flushes, and having 4 equivalent suits results in many variants of equivalent hands in the above Seven table. I was able to simplify things by having only two suits – “S” (for suited or spades) and “N” (for not suited or not spades). I built separate queries for the flush hands (“S” cards; “FiveFlush” and “SevenFlush” queries) and non-flush hands (“N” cards, “FiveNot” and “SevenNot” queries). In each, a column with the number of hands represented is also calculated. For example, the hand “.2S|.3S|.4S|.5S|.6S” represents 4 hands (the 6-high straight flushes in each suit), while the “.2N|.3N|.4N|.5N|.6N” represents 1024 hands (4^5). To avoid double counting, we subtract the 4 flush hands from that to get 1020 equivalent hands. This one is simple, but it gets more complicated when you have multiple “N” cards of the same rank and 7-card hands with 5 “S” cards and 0-2 “N” cards. I won’t go through every step and will just mention some of more interesting M expressions. You can see all the steps in this file.
While this approach greatly reduces the dataset, it complicates both the M and DAX expressions. We build the queries just like before, but a few steps are different/more complex. For example:
There can be only one of each S card in a hand, so we first have to filter each list to just the S cards before we find the distinct count. For this, we use List.FindText() as follows, followed by a filter step:
=List.Distinct(List.FindText([FiveList], “S”))
Next, while we can have multiple N cards of each rank, we can have no more than 4 of them (e.g., 4 “.7N”s would be 4 of a kind). The M code below makes a list of the frequency that each N card rank is found in the list and then takes the max of that list. We then filter out the rows where that max is >4.
= let
templist=[SevenList]
in
// Make a list of how many times each card is found in the list, take max with List.Max()
List.Max(List.Transform(List.Distinct(templist), each List.Count(List.FindText(templist,_))))
To tie our model back to a full standard deck with four suits, we can calculate for each hand the number of equivalent hands it is representing (depending on how many N cards it has and how many of those have the same rank). We can then use the sum of the equivalent hand’s column in our DAX measures where we would have used a countrows() of the full table. For the flush hands in the Seven table (hands contain 5-7 “S” cards and 0-2 “N” cards, as the hands with the 6th and/or 7th card not suited need to be represented too), the number of equivalent hands can be calculated with:
[Equiv Hands] (flushes)
4*Number.Power(3, [TwoNDC])
//where [TwoNDC] is a column with the distinct count of N cards in the hands calculated in a previous step with List.Count(List.Distinct(List.FindText([TwoList.1], “N”)))+0
For example, a hand with 5 “S” cards and two different “N” cards would represent 36 other hands (3 is used in the Number.Power since one of the suits is taken by the “S” cards, and the “N” cards have to be different. When the two “N” cards are the same, only 3 possibilities exist for each of the 4 flush hands (12 total).
For the non-flush hands, we need to calculate the total possible and then subtract the number of flush hands possible. To calculate the number of flush hands, it helps to introduce the concept of a Rank Pattern. We’ll use it a lot in Part 2 for scoring each hand, but it helps now too. The Rank Pattern is a way to encode the frequency of each rank in a given hand and can be calculated as follows with M (you’ll see DAX equivalent in Part 2). Just look at the last line in which we raise 10 to the power of the count of each rank, and then sum those values. For example, a full house has a Rank Pattern of 1100 (10^3+10^2), while 5 different ranks have a pattern of 50 (5 * 10^1).
[RankPattern]
let
ranklist=List.Transform([SevenList], each Text.Select(_, {“0”..”9″, “.”})),
countslist = List.Transform(List.Distinct(ranklist), each List.Count(List.FindText(ranklist, _)))
in
List.Sum(List.Transform(countslist, each Number.Power(10, _)))
There are only 4 Rank Patterns of 7 “N” hands that can result in flush hands, and the number of possible flushes is found through a nested if expression (not shown). To calculate the number of possible hands (to subtract possible flushes from), we use the following expression:
[Equiv for N Hands]
let
Nlist = [SevenList],
NCount = List.Count(List.Distinct(Nlist))+0,
equiv=List.Product(List.ReplaceMatchingItems(List.Transform(List.Distinct(Nlist), each List.Count(List.FindText(Nlist, _))), {{1,4}, {2,6}, {3,4}, {4,1}}))
in
equiv -[PossibleFlushes]
In order to wrap things up, I won’t explain in great detail why this calculation helps us get to the equivalent number of hands. Just know that it takes the product of a list generated by replacing the frequency that each rank is found in the list of N cards with the number of possible suit combinations (e.g., there are 4 versions of a hand with a single “.7N” card, but only one version with four “.7N” cards; there are no “S” cards in this query).
Go ahead, read that sentence again; there is a lot going on.
Summary
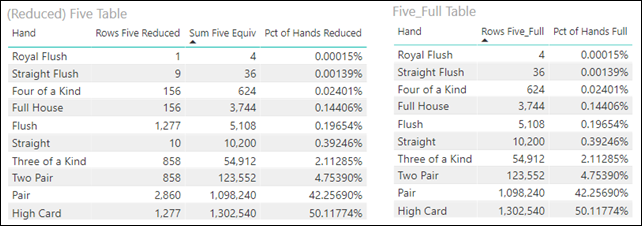
With this reduced approach, the Five table has 7,462 rows (348X less than the full 2.6M!), and the Seven table has 190,346 rows (703X less than the full 133M!). The expanded SevenExp table now has just under 20M rows (far less the original 14B). Fortunately, the sum of the equivalent hand’s column exactly matches the expected “full” table versions, as shown below:
We’ll score all this in Part 2, but the image below shows that we get the same probability of each type of hand using both the “full” and “reduced” approaches for the five-card hands (we’ll deal with seven card hands in Part 2).
I told you up front that I went way down this rabbit hole, so thanks to anyone that read through it all. The fact that we can do stuff like this (both the brute force full tables and the advanced calculations needed for the reduced approach) shows the power of Power BI (#StuffTableauCan’tDo). Stay tuned for Part II where we’ll score these hands with DAX (and show an M-based alternative), and make a dashboard to see the best possible hand given the two cards you are dealt vs. what the other players might be holding.
Where It’s At: The Intersection of Biz, Human, and Tech*
We “give away” business-value-creating and escape-the-box-inspiring content like this article in part to show you that we’re not your average “tools” consulting firm. We’re sharp on the toolset for sure, but also on what makes businesses AND human beings “go.”
In three days’ time imagine what we can do for your bottom line. You should seriously consider finding out 🙂
* – unless, of course, you have two turntables and a microphone. We hear a lot of things are also located there.
