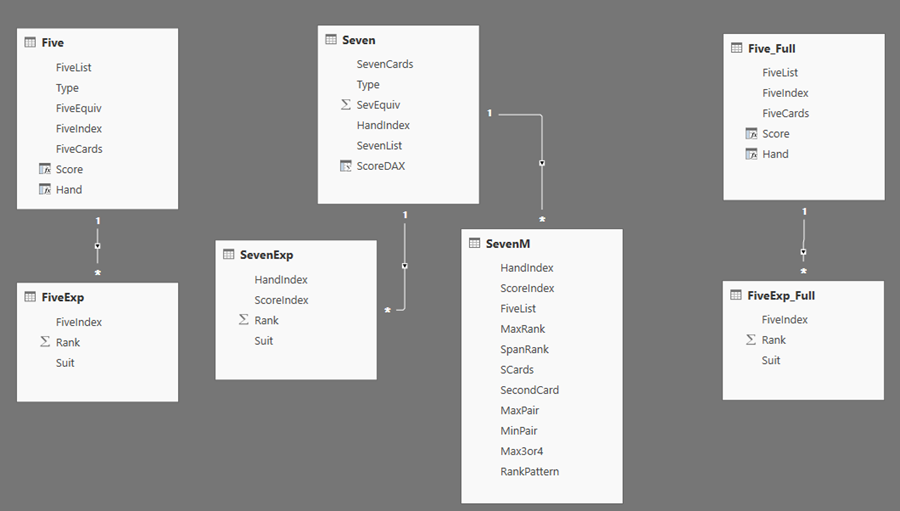
In Part I, we used the query editor and the M List functions to generate all the possible combinations of five and seven cards from a standard deck. To score all the possible combinations of seven cards (133M possible hands X 21 ways to pull 5 cards from 7 X 5 cards/hand = >14 billion rows) was more than my computer could handle, so an approach to significantly reduce the data was described (~20M rows instead of ~14B). You can download a copy of the final .pbix to follow along with here. Admittedly, I went way into the weeds on these two posts. intermediate/advanced users may learn a couple tricks (and hopefully send some back in the comments), but I hope beginners may skim through it too for awareness of what is possible and help them continue their journey. The data model at this point looks like this.
There are seven tables shown (# rows in parentheses):
- Five_Full (2,598,960) – all the possible five-card hand variations for a 52-card deck
- Five (7,462) – the above combinations represented with suits of “S” (for flush hands) and “N” for non-flush hands; includes a column with the number of equivalent hands represented, the sum of which equals 2,598,960
- Seven (190,346) – all possible seven-card combinations with the reduced representation (includes “S” and “N” cards (only 5 of the 7 cards need to be suited to get a flush); the sum of its Equivalent hand’s columns equals the expected 133,784,560M
- FiveExp_Full (12,994,800) – the Five_Full table expanded with each card on its row with separate columns for Rank and Suit
- FiveExp (37,310) – the expanded Five table
- SevenExp (19,986,330) – the Seven table expanded with the 5 cards from each of the 21 ways to pull 5 cards from 7 on their row with Rank and Suit
- SevenM (3,997,286) – not described in Part I. This table is a duplicate of SevenExp but stops when we have the 5 cards still in list form (used below to demonstrate scoring a hand mostly with M vs. DAX).
Each of the top tables has a relationship to its expanded table through an index column so that we can generate a “Score” calculated column on the parent table. With the tables populated and relationships in place, it’s time to score them.
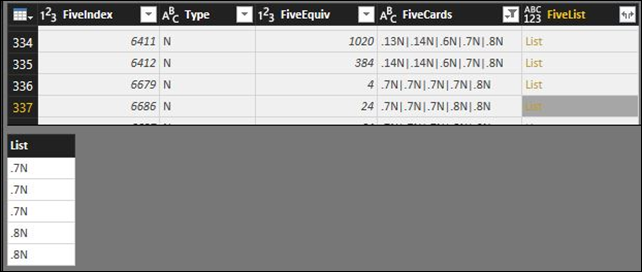
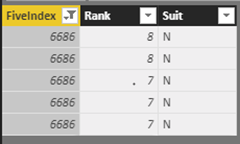
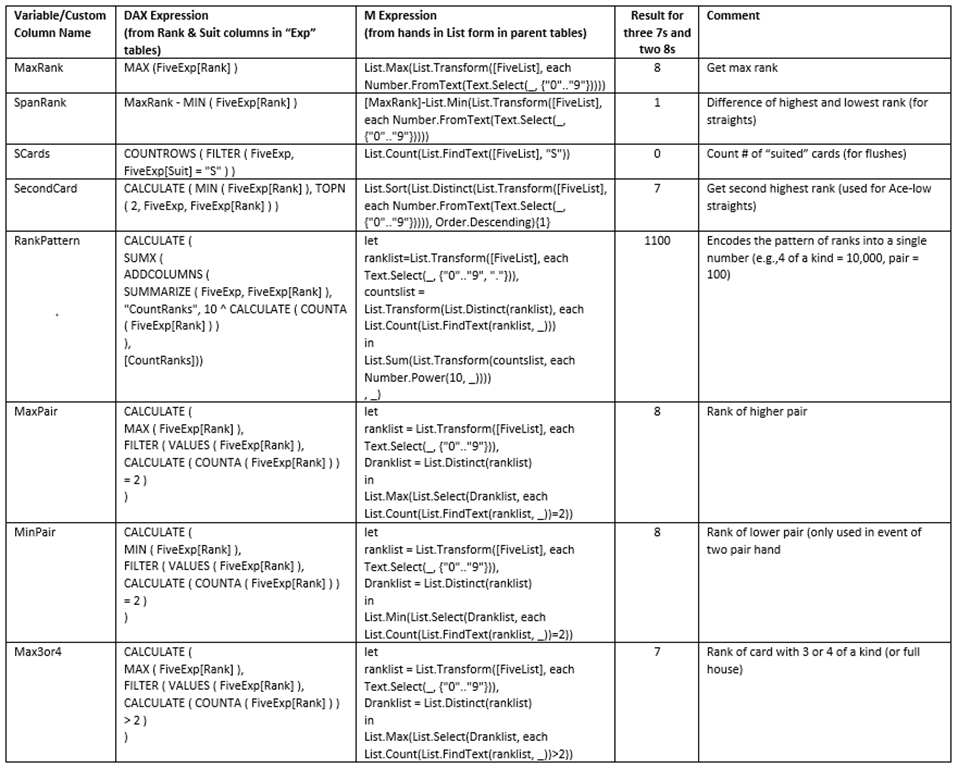
This is a perfect application for Switch(True()), but first there are a set of variables/columns we need to calculate to classify the hands (Flush, Straight, Pair, etc.) and a few more to score them relative to each other (so a pair of tens beats a pair of nines, for example). The variables we need can also be calculated as custom columns in the query to simplify the DAX and spread the work out for your computer. Below is a table that shows the variables/columns we need and how to calculate them in both DAX and M, for a representative Full House hand (“7’s over 8’s”). The M expressions are used in the parent tables when our five-card hand still exists in List form; the DAX expressions calculate from the parent table using the “Rank” and “Suit” rows of the child/expanded tables. The slightly modified expressions for the “Full” tables are not shown, but some are included in the model file to save space. The rest of this article will focus on just the reduced dataset, as we couldn’t fully expand the SevenExp table and some of these DAX expressions on the 2.9M rows Five_Full table are pretty slow. Below you can see how our example hand looks as a list and in the “Exp” tables.
and exp form
The final DAX expression is as follows for the “Score” calculated column on the Five (reduced) table. With Switch(True()), it iterates through all the steps until it finds the first one that is True.
Score Five R =
VAR MaxRank =
MAX ( FiveExp[Rank] )
VAR SpanRank =
MaxRank – MIN ( FiveExp[Rank] )
VAR SCards =
COUNTROWS ( FILTER ( FiveExp, FiveExp[Suit] = “S” ) )
+ 0
VAR SecondCard =
CALCULATE ( MIN ( FiveExp[Rank] ), TOPN ( 2, FiveExp, FiveExp[Rank] ) )
VAR RankPattern =
CALCULATE (
SUMX (
ADDCOLUMNS (
SUMMARIZE ( FiveExp, FiveExp[Rank] ),
“CountRanks”, 10 ^ CALCULATE ( COUNTA ( FiveExp[Rank] ) )
),
[CountRanks]
)
)
VAR maxpair =
CALCULATE (
MAX ( FiveExp[Rank] ),
FILTER ( VALUES ( FiveExp[Rank] ), CALCULATE ( COUNTA ( FiveExp[Rank] ) ) = 2 )
)
VAR minpair =
CALCULATE (
MIN ( FiveExp[Rank] ),
FILTER ( VALUES ( FiveExp[Rank] ), CALCULATE ( COUNTA ( FiveExp[Rank] ) ) = 2 )
)
VAR max3or4 =
CALCULATE (
MAX ( FiveExp[Rank] ),
FILTER ( VALUES ( FiveExp[Rank] ), CALCULATE ( COUNTA ( FiveExp[Rank] ) ) > 2 )
)
RETURN
SWITCH (
TRUE (),
AND ( AND ( SpanRank = 4, SCards = 5 ), RankPattern = 50 ), 1600 + MaxRank,
AND (
AND ( AND ( SecondCard = 5, SCards = 5 ), RankPattern = 50 ),
MaxRank = 14
), 1600 + SecondCard,
RankPattern = 10010, 1400 + max3or4,
RankPattern = 1100, 1200 + max3or4,
SCards = 5, 1000 + MaxRank,
AND ( SpanRank = 4, RankPattern = 50 ), 800 + MaxRank,
AND ( AND ( SecondCard = 5, RankPattern = 50 ), MaxRank = 14 ), 800 + SecondCard,
RankPattern = 1020, 600 + max3or4,
RankPattern = 210, 400
+ 10 * maxpair
+ minpair,
RankPattern = 130, 200 + maxpair,
MaxRank
)
Note: the different types of hands are separated by 200 points each, since I needed a way to score the Two Pair and Full House hands (both ranks considered when comparing two players also with Two Pair or a Full House). In those cases, the higher pair or rank of 3 cards in the full house is multiplied by 10 and added to the score (max 140 addition for Aces).
If the M expressions are used to create our variables as columns in the query editor using the expressions above, a simpler DAX expression can then be used, and we don’t even need the “Exp” table at all. The table called “SevenM” is the intermediate table with 21 lists of five cards from the Seven table, but not expanded to each row as in the SevenExp table). In this case, the variable statements only need to get the values from those already-calculated columns (e.g., var MaxRank=[MaxRank]).
Once we have the [Score] column, we can then classify each hand with another, simpler Switch(True()) expression:
Hand =
VAR Score1 = [Score] //Value from the Score calculated column in same table
RETURN
SWITCH (
TRUE (),
Score1 = 1614, “Royal Flush”,
Score1 > 1600, “Straight Flush”,
Score1 > 1400, “Four of a Kind”,
Score1 > 1200, “Full House”,
Score1 > 1000, “Flush”,
Score1 > 800, “Straight”,
Score1 > 600, “Three of a Kind”,
Score1 > 400, “Two Pair”,
Score1 > 200, “Pair”,
“High Card”
)
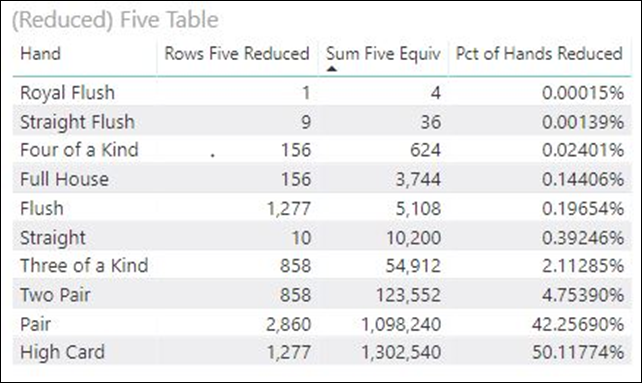
And once we have that, we can use the following two expressions to get the total number of hands of each type, as well as the percent probability to get each one.
Sum Five Equiv =
SUM ( Five[FiveEquiv] )
Pct of Hands Reduced =
[Sum Five Equiv] / CALCULATE ( [Sum Five Equiv], ALL ( Five ) )
We can then use the same approach on the Seven table to score all the 21 ways to pull 5 cards from seven and use MAXX() to get the best possible hand with this expression. We also use the same Hand expression above to make that column on the Seven table as well.
Maxx Score Seven R =
MAXX ( VALUES ( SevenExp[ScoreIndex] ), [Score SevenExp R] )
//[Score SevenExp R] is the same as [Score Five R] above but pointing to the SevenExp table instead (liked that Ctrl-Shift-L keyboard shortcut on that one)
Now that all the hands are scored and classified, this model can be used for analysis of five or seven card hands (it could even be modified for use with more than one deck with some minor modification to the queries). However, it can also be used during a hand to see what the best possible hand is given the cards seen so far.
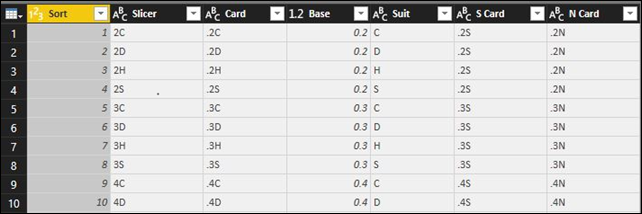
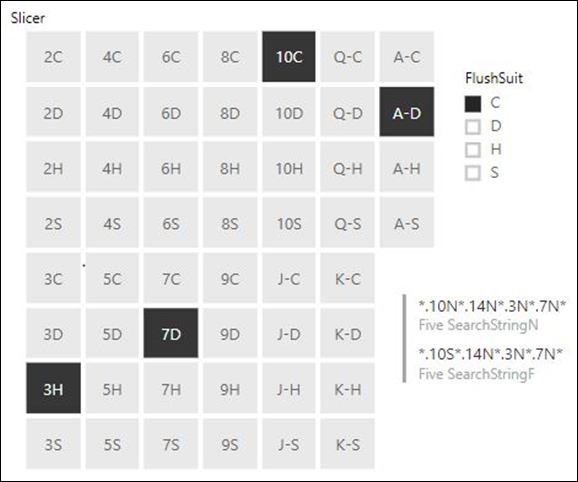
The first step is the make a slicer to capture the cards seen so far during a given hand. Rather than asking our user to understand our reduced model with “N”s and “S”s, we can make a table with a column with the typical card values (e.g., 10C, 5D) to be used for the slicer selections, and add columns to encode that hand to match the syntax in our model. Here are a few rows of the Slicer_Five table and a pic of the slicer.
Now we need to filter our card tables with the hand generated by the slicer as cards are dealt. While it is possible to write DAX to find hands in the parent tables with rows that match all the dealt cards in the “Exp” tables, I went another way (since I ended up avoiding the “Exp” tables altogether by using the M columns). At first, I thought I’d have to use nested Search() and Substitute() functions to filter the tables (Substitute() since I was looking for multiple “N” cards of the same value (up to 4 of them in a given hand). Fortunately, I found a simpler way, since the Search function can accept multiple wildcards (i.e., “*”).
The parent tables have each hand represented as a text string; our example hand looks like “.7N|.7N|.7N|.8N|.8N”. The first step was to convert the slicer selections into the same syntax, in the same order. Actually, we do two string searches, one through all the flush hands and a second through all the not-flush hands. Here is the expression used:
Five SearchStringN =
IF (
COUNTROWS ( Slicer_Five ) <= 5,
“*”
& CONCATENATEX ( Slicer_Five, Slicer_Five[N Card], “*”, Slicer_Five[N Card] )
& “*”,
“*”
)
The search string through the flush hands is more complicated, as it also compares the rank of each card to the value of a slicer for the potential flush suit selected by the user, to decide which cards should be encoded as “S” cards and “N” cards to search for them.
Five SearchStringF =
VAR selectedsuit =
IF (
HASONEVALUE ( SuitSelect[FlushSuit] ),
FIRSTNONBLANK ( SuitSelect[FlushSuit], 1 )
)
VAR concattable =
SUMMARIZECOLUMNS (
Slicer_Five[Card],
Slicer_Five[Base],
“Concat”, CALCULATE (
IF (
FIRSTNONBLANK ( Slicer_Five[Suit], 1 ) = selectedsuit,
FIRSTNONBLANK ( Slicer_Five[S Card], 1 ),
FIRSTNONBLANK ( Slicer_Five[N Card], 1 )
)
)
)
RETURN
IF (
COUNTROWS ( concattable ) <= 5,
“*” & CONCATENATEX ( concattable, [Concat], “*”, [Concat], ASC )
& “*”,
“*”
)
Thankfully, the Concatenatex() function has a Order By parameter and we put the name of our column dynamically generated in the SummarizeColumns() table. With that, all the “N” and “S” cards end up in the correct order to get matches upon searching. The two strings generated by the expressions above are shown in the slicer image above.
Note that the wildcard “*” is used as the concatenation symbol and the whole string is bracketed by wildcards too. For example, if the 7C and 8D were selected from the slicer, the above expression would generate “*.7N*.8N*.” (if Clubs were selected as the suit, it would also generate “*.7S*.8N*.”).
The next step is the use that string in a Search() expression to filter our parent tables. Here is the expression to calculate the best possible score given the slicer cards selected. First, the two search strings are generated, then two tables (the flush table and the not flush table), then the max score is calculated in each table, with a filter based on a match with their respective search expression. Finally, the two max scores are compared, and the higher one is returned.
Five Slicer Max Score R test =
VAR selectedcardsN =
IF (
COUNTROWS ( Slicer_Five ) <= 5,
“*”
& CONCATENATEX ( Slicer_Five, Slicer_Five[N Card], “*”, Slicer_Five[N Card] )
& “*”,
“*”
)
VAR selectedsuit =
IF (
HASONEVALUE ( SuitSelect[FlushSuit] ),
FIRSTNONBLANK ( SuitSelect[FlushSuit], 1 )
)
VAR selectedcardsF =
“*”
& CONCATENATEX (
ADDCOLUMNS (
SUMMARIZE ( Slicer_Five, Slicer_Five[Card] ),
“Concat”, IF (
FIRSTNONBLANK ( Slicer_Five[Suit], 1 ) = selectedsuit,
FIRSTNONBLANK ( Slicer_Five[S Card], 1 ),
FIRSTNONBLANK ( Slicer_Five[N Card], 1 )
)
),
[Concat],
“*”,
[Concat], ASC
)
& “*”
VAR NTable =
FILTER ( Five, Five[Type] = “N” )
VAR STable =
FILTER ( Five, Five[Type] = “F” )
VAR Nmax =
CALCULATE (
MAX ( Five[Score] ),
Ntable,
SEARCH ( selectedcardsN, Five[FiveCards],, BLANK () )
)
VAR Smax =
CALCULATE (
MAX ( Five[Score] ),
Stable,
SEARCH ( selectedcardsF, Five[FiveCards],, BLANK () )
)
RETURN
IF ( Nmax >= Smax, Nmax, Smax )
A similar measure is also used to calculate the # of hands (sum of the equivalent hands column) of each type (straight, flush, pair, etc.) that match the pattern, so we can calculate the % chance as cards are dealt (using Show Values as % of Grant Total in the measure, or by using an ALL() expression in the calculation).
I promised I would try to make this post shorter than the first so that I won’t show the Seven version, but you can combine the values from two slicers (one for the two hands dealt to each player in Hold ‘Em, and second for the five cards shared by all). One could also add additional two-card slicers and measures to track the possible hands for other players.
I continue to be impressed with what Power BI/Excel can do and learned a lot of new stuff to finish this model (especially about M List functions). The data transformations possible with M and the complex calculations enabled by DAX are amazing. When it comes to Power BI vs. Tableau (or other tools), I think there is no contest. I like to say that Tableau is to Power BI as a calculator is to a smartphone (both seem amazing to someone used to an abacus, but one is much more powerful). Power BI – Come for the transforms & visuals, stay for the analyses (DAX).
I hope you enjoyed the trip down this particular rabbit hole. This one took a while to sort it all out; my next one will be much simpler in scope (I hope).
Where It’s At: The Intersection of Biz, Human, and Tech*
We “give away” business-value-creating and escape-the-box-inspiring content like this article in part to show you that we’re not your average “tools” consulting firm. We’re sharp on the toolset for sure, but also on what makes businesses AND human beings “go.”
In three days’ time imagine what we can do for your bottom line. You should seriously consider finding out 🙂
* – unless, of course, you have two turntables and a microphone. We hear a lot of things are also located there.
