
I watched a video from Guy in a Cube’s Patrick featuring Marco Russo where they walked through an example using a technique to debug DAX measures using VAR/RETURN – I loved this!
https://www.youtube.com/watch?v=9SV2VnYbgg4
The video made me recall another Blog Post by Matt Allington, where he stepped through an example illustrating a technique to create complex DAX expressions.
https://exceleratorbi.com.au/how-to-solve-a-complex-dax-problem/
This made me think… sharing some other helpful techniques might make for a good Blog Post or even a series of Blog Posts!
To kick off this idea… I’d like to start with my MOST important Power BI data model development technique, which I’m going to call the KAT. Why give it a name… well, why not!
I mean the founder of our company, Rob Collie, has a technique or rather a method called the “Collie Methodology”. If you’re not familiar with this, it’s simply the arrangement that we use in the data model relationship view where the Lookup tables are arranged on top, and the Data tables are on the bottom – this method helps you visualize how the table relationships flow down like “transmission wires” to the Data tables. There’s a great reference to this method in Matt Allington’s Blog Post here:
https://exceleratorbi.com.au/the-optimal-shape-for-power-pivot-data/
So back to my MOST important technique … the one that I’m calling KAT! This stands for “Krissy’s Auditing Technique,” which simply states that ALL tables should have at least one minimum measure… and that minimum measure uses the COUNTROWS() DAX function.
COUNTROWS() is my absolute favorite of all the DAX functions!
Why this simple and most basic measure COUNTROWS() you ask? Well, as my kids often say to me… “REASONS!”
REASON #1: Auditing Grand Totals
If you’ve seen my previous blog post Finding the Right Data using SQL or Power BI, where I share ideas using SQL or Power BI to find the right tables and columns… well, the next step to validate and audit that you’ve got the right tables and columns is to create a base measure! And I always use the COUNTROWS() DAX function to audit my grand totals!
For example, if I had a use case where I’m trying to identify the universe of accounts by their account score. I would…
- Locate the table(s) and column(s) needed
- Load the source data as a table into the data model
- Add a base measure using the COUNTROWS() DAX function and audit that the number of accounts by account score looks to be as expected
In the example above, I can see that my universe of accounts is 50 and I can also check the totals by the [Account Score] values GOLD, SILVER, and BRONZE.
If my universe should contain more than 50 accounts <OR> if my counts by the [Account Score] does not look correct, then I can go back to the source data and try to locate the correct source data before going any further into my development.
REASON #2: Using Excel as a client tool to connect to a PBIS or SSAS tabular data model
When you create a data model that is published to the Power BI Service (PBIS) <OR> you create a data model that has been deployed to SQL Server Analysis Services (SSAS) then any user that may want to use Excel as a client tool to connect to your data model, must have at least one measure! Otherwise, the user is limited to placing fields on Rows/Columns with no measures… and trust me, a model without any measures is NOT going to help anyone!
Let me illustrate using an example. NOTE: To follow along, you will need 1.) a Power BI Service account, to log in and test the .PBIX example files and 2.) the two .PBIX example files.
PBID Data Model Reason 2 – No Measures
PBID Data Model – Reason 2 – Measures
The first example .PBIX file is a simple data model, with NO measures. Follow these steps:
a.) Download the two example files “PBID Data Model – No Measures.pbix” & “PBID Data Model – Measures.pbix”.
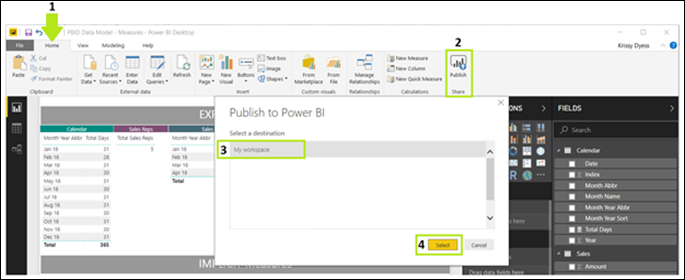
b.) Open the file called “PBID Data Model – No Measures.pbix” and Publish to My Workspace then close the file.
c.) Open the file called “PBID Data Model – Measures.pbix” and Publish to My Workspace then close the file.
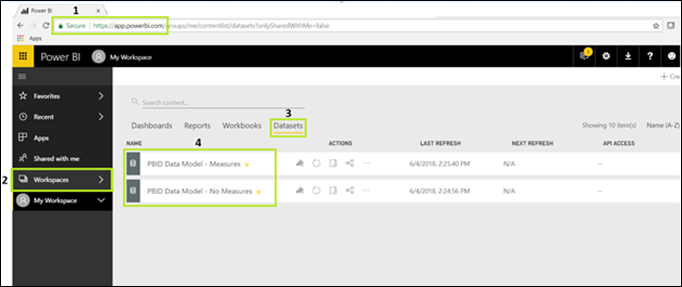
d.) Check that both files are published to the service (log into the service to verify the Datasets are published).
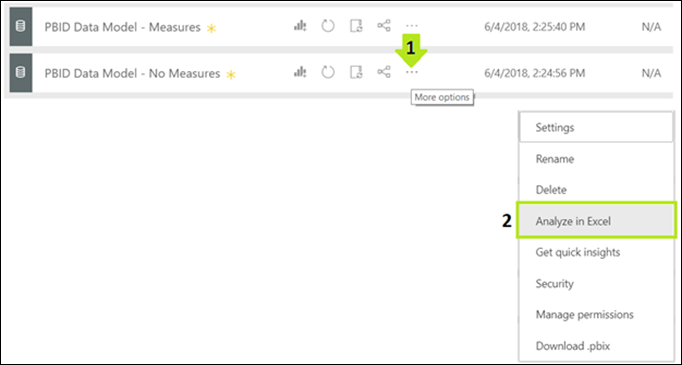
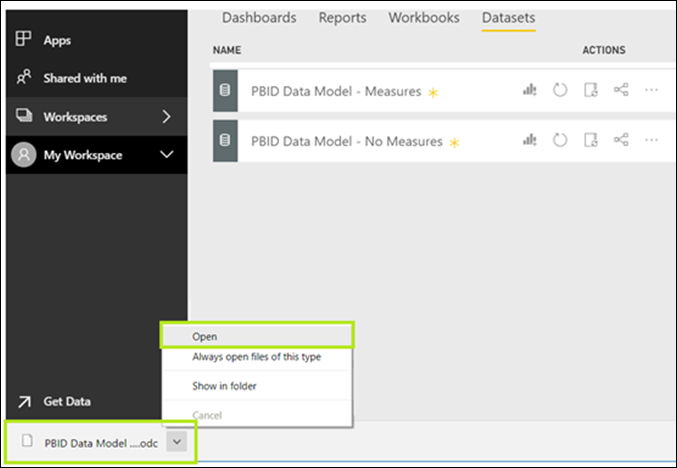
e.) Hover over the Ellipse; you’ll see there are “More options” this is where you display the “More Options” menu, and you can select the “Analyze in Excel” option.
f.) This will create a “PBID Data Model – No Measures.odc” file that you can open in Excel.
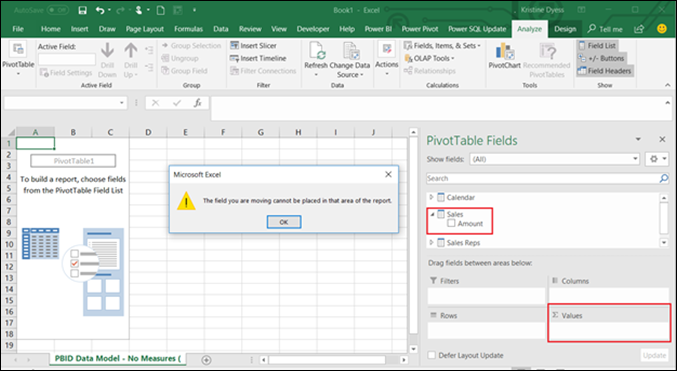
g.) Next, try to create a Pivot Table to show ‘Sales’[Amount] in the Values and ‘Sales Reps’[Sales Rep Name] in the Rows… and this is where you’ll get stuck! There are NO Explicit measures that can be placed into the Values section of a Pivot Table or a Pivot Chart!
h.) Now, let’s look at the other example Dataset that we published called “PBID Data Model – Measures”. But this time, let me show you a different method of connecting to a data model in PBIS, by downloading the free Power BI Publisher Add-In for Excel.
About Link: https://docs.microsoft.com/en-us/power-bi/publisher-for-excel
Download Link: https://powerbi.microsoft.com/en-us/excel-dashboard-publisher/
i.) Once you’ve downloaded the Power BI Publisher Add-In for Excel, open a new blank Excel workbook file.
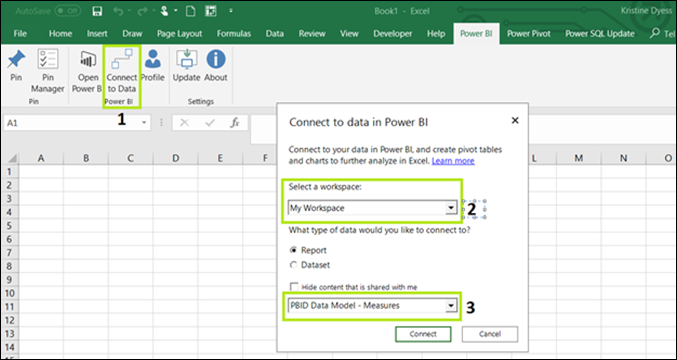
j.) Notice that you’ll have a new option available in the Excel Menu called Power BI – select this new Power BI Menu option.
k.) Select the “Connect to Data Power BI” button and then select “My Workspace” and “PBID Data Model – Measures” then the Connect button.
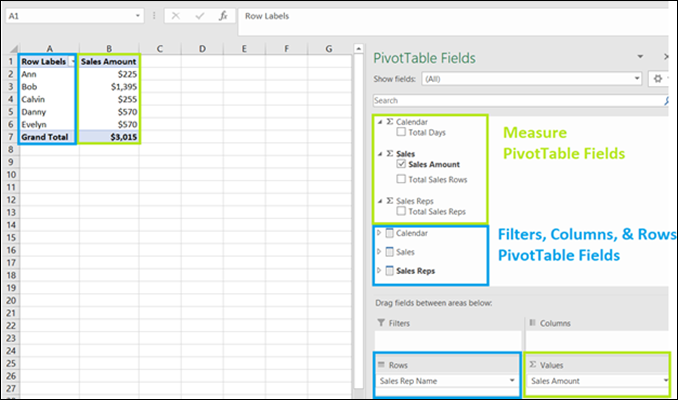
l.) Now, let’s try again to create a Pivot Table with ‘Sales’[Amount] in the Values and ‘Sales Reps’[Sales Rep Name] in the Rows… and now you can! This is exactly why you need Explicit measures created in your data model!
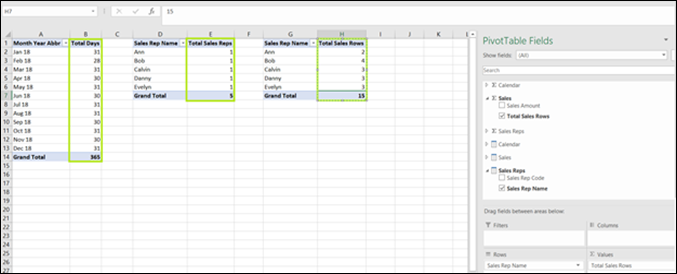
By having, at minimum, the COUNTROWS() Explicit measure on each of the tables in the data model… I can at least tell you how many [Total Days] there are in the ‘Calendar,’ how many [Total Sales Reps] are in ‘Sales Reps’ and the [Total Sales Rows] volume of ‘Sales’ records – all vital for auditing, development and troubleshooting purposes!
REASON #3: Auditing, Validating, and Troubleshooting DAX measures!
Finally, the COUNTROWS() DAX function can be used to create a simple base measure that you can use to audit, validate or debug any more complex DAX formulas.
It’s very easy to SEE what’s being included or excluded when you know how many total rows your have – this simple base measure is the easiest one to use to audit and verify your expected results!
Unless, of course, you fall into the most common of all “Rookie Mistakes” where you don’t realize that you have filters/slicers set! And quite honestly, a lot of times… those filters/slicers are the cause as to WHY you THINK your complex measure is not working! And a COUNTROWS() base measure can help you to identify this – because your grand total is always your grand total!
Let me further illustrate with an example of how COUNTROWS() can be used to debug a complex DAX measure…
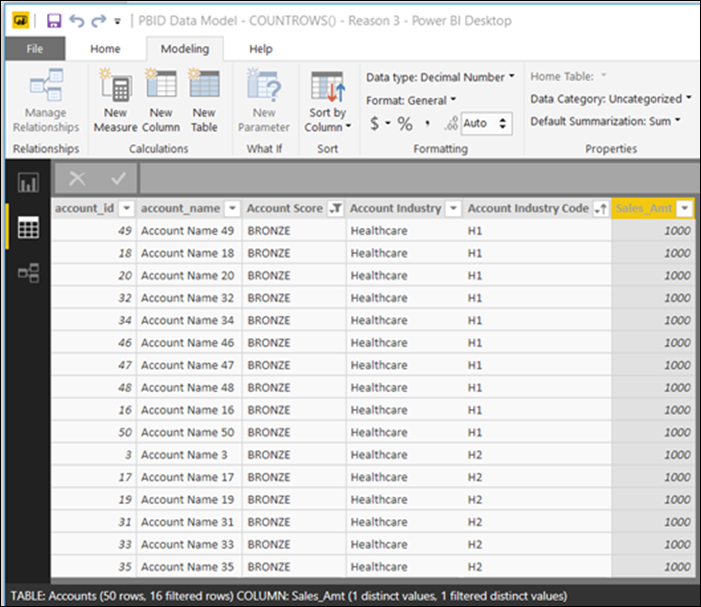
If I wanted to create a measure that displayed a base measure value for records with [Account Score] = “BRONZE” and [Account Industry Code] = “H2”, I can create…
- A visual to audit how many rows contain [Account Score] = “BRONZE” (total = 16)
- A visual to audit how many rows contain [Account Industry Code] = “H2” (total = 23)
- A visual for [Account Score] = “BRONZE” and [Account Industry Code] = “H2” (total = 6)
I now know that my result should be (6) and I can work on creating the more complex business logic needed.
I decided that the complex business logic for this example is just going to be to display the total sales from [Account Score] = “BRONZE” and [Account Industry Code] = “H2” account in a card visual.
And thanks to my favorite DAX function COUNTROWS() and my base measure [Account Rows], I can be sure that I’ve got the correct value being calculated in my DAX formula for the card visual!
And once, I’ve validated that I’ve got the correct value in terms of the COUNTROWS() base measure, I can swap out the [Account Rows] base measure for the [Sales] base measure and know that $6,000 is the expected total sales from the (6) account with [Account Score] = “BRONZE” and [Account Industry Code] = “H2”.
… And also to keep things simple for my example, I assigned each of the 50 accounts a [Sales_Amt] of $1,000… which means that the “Total Sales” would equal $50K for my 50 accounts and my “Bronze & H2 Sales” would equal $6K for the 6 accounts that meet the criteria.
So, there you go… 3 reasons why COUNTROWS() is my favorite DAX function! And the technique that I’m officially calling the KAT ‘s (meow)![]()
Did you find this article easier to understand than the average “tech” article?
We like to think that is no accident. We’re different. First of a new breed – the kind who can speak tech, biz, and human all at the same time.
Want this kind of readily-absorbable, human-oriented Power BI instruction for your team? Hire us for a private training at your facility, OR attend one of our public workshops!

![image [Account Rows] on all 3 visuals](png/image_thumb-219.png)




![image COUNTROWS['CHEEZBURGER']](png/image_thumb-234.png)
Your email address will not be published.