With the Power BI craze that kicked into high gear in 2017, it’s less common to be working in PowerPivot in Excel. However, during one of my recent remote consulting calls, one of our many clients needed some help with a solution created in PowerPivot in Excel.
And I often find if ONE person needs help or has a particular question about how to create a solution then it’s possible MANY other people might have a similar question or solution need. As such, that is the inspiration for today’s post!
I also like this solution idea that I’m about to share because it showcases a use case for why someone might prefer a PowerPivot In Excel solution over Power BI Desktop solution.
You can download the excel workbook to follow along with here.
Use Case
Let’s say you have…
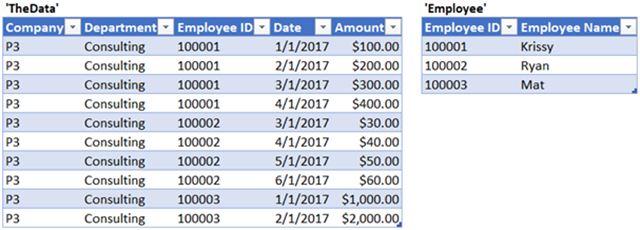
- a DATA table called ‘TheData’ with [Company], [Department], [Employee ID], [Date], [Amount]
- a LOOKUP table called ‘Employee’ with [Employee ID] and [Employee Name]
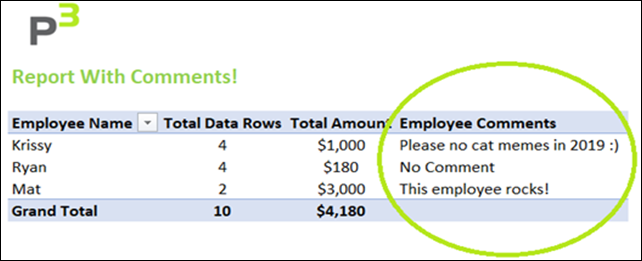
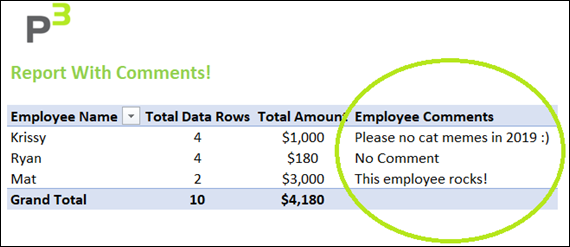
You want to be able to create a Pivot Table report with the following information from ‘Employee,’ ‘TheData’ and [Employee Comments] …
- [Employee Name], [Total Data Rows], [Total Amount] AND [Employee Comments]
Requirements
- The source data comes from a SQL database or some other system source that you do not have access to edit
- The list of [Employee ID] and [Employee Name] must update dynamically – to include and new Employees or Employee changes
- The [Comments] will be manually entered and maintained in the Excel Workbook Solution File
Solution
The solution will use Data > Existing Connections > Tables to load the results from the ‘Employee’ table in the Data Model to a worksheet where the [Comments] column can be added, edited and loaded back into the Data Model.
Solution Steps
1.) Connect to the ‘TheData’ & ‘Employee’ data sources using Power Query
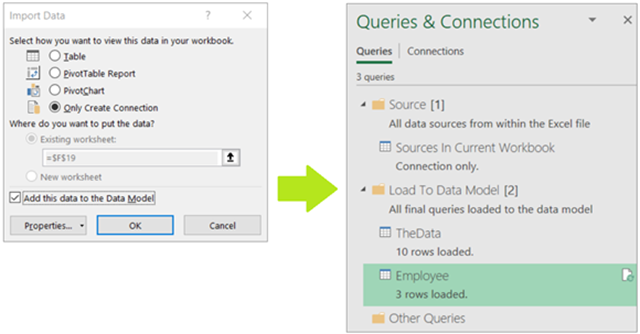
2.) Choose Home > Close and Load… Only Create Connection and Add this to the Data Model
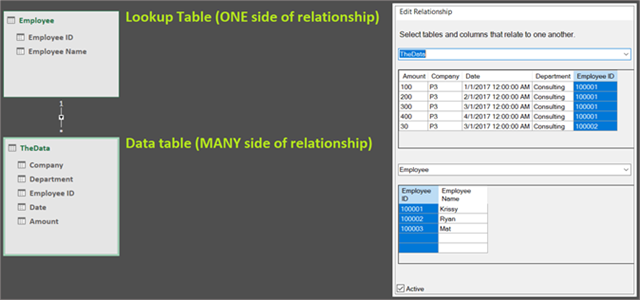
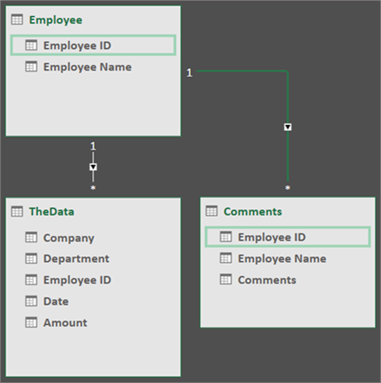
3.) Create a Relationship from the MANY (*) side ‘TheData’[Employee ID] to the ONE (1) side ‘Employee’[Employee ID]
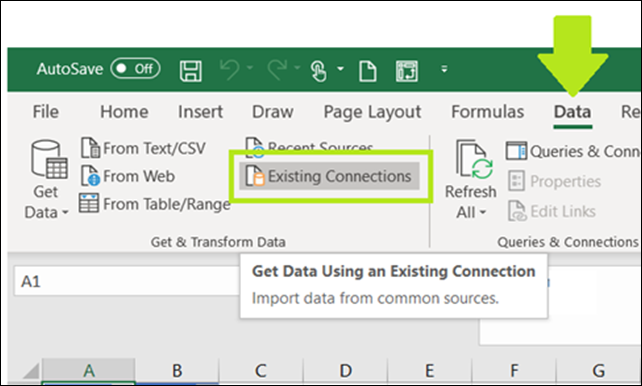
4.) Then, in a new worksheet, select Data > Existing Connections
Now, here’s the trick…
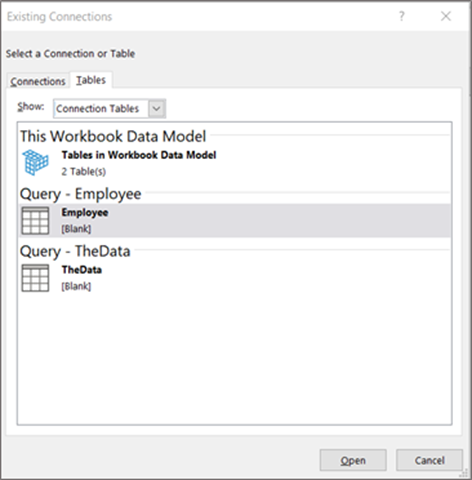
5.) From the Existing Connections choose the Tables tab and Show: Connection Tables, pick ‘Query – Employee’ and select Open
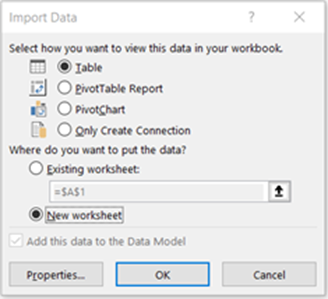
6.) Choose the Table, New Worksheet then select OK
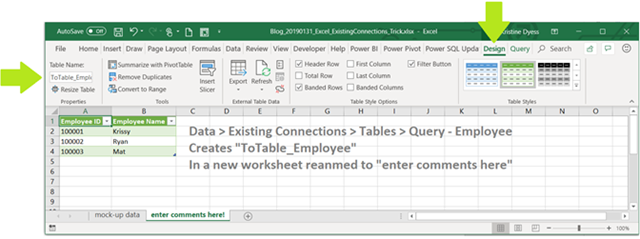
7.) This will load the data from the ‘Employee’ table in the data model into a new worksheet
8.) Select Design from the menu and give the table a new name ‘ToTable_Employee’
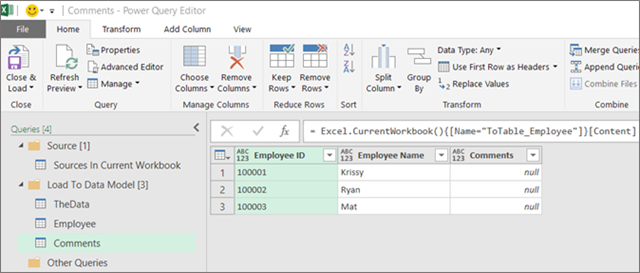
9.) Now let’s add a column called [Comments] to the ‘ToTable_Employee’ table
10.) Select Data > From Table/Range to bring this new dynamic table into Power Query – let’s call it ‘Comments’
11.) Choose Home > Close and Load… Only Create Connection and Add this data to the Data Model
12.) The ‘Comments’ table loads to the data model, then create the Relationship from the MANY (*) side ‘Comments’[Employee ID] to the ONE (1) side ‘Employee’[Employee ID]
13.) Lastly, we can create the PivotTable report!
Now, any time a user enters comments on the worksheet, select Refresh on just the ‘Comments’ query in your Data > Queries & Connections pane, and the comments will be added to the report worksheet. And when you add new Employees or change Employees in the source data, a Data > Refresh All will update the ‘Table_Employee’ information, and you can enter the comments.
Conclusion
PowerPivot In Excel workbooks can be a great solution when you want to easily allow an end user to inject information into a data model report or dashboard!
So, in staying committed to PUG memes for 2019 – I thought this one was entirely appropriate for two reasons…
Reason #1
PowerPivot In Excel is indeed an OLD friend, now that Power BI Desktop has taken center stage! But there ARE many other reasons that a PowerPivot in Excel solution is just what you need.
Reason #2
For our northeastern friends experiencing the Winter 2019 polar vortex, sending you WARM sunshine vibes.
Happy Power Pivoting in Excel 🙂
Microsoft’s platform is the world’s most fluid & powerful data toolset. Get the most out of it.
No one knows the Power BI ecosystem better than the folks who started the whole thing – us.
Let us guide your organization through the change required to become a data-oriented culture while squeezing every last drop* of value out of your Microsoft platform investment.
* – we reserve the right to substitute Olympic-sized swimming pools of value in place of “drops” at our discretion.
