Welcome back! Today we are going back to RANKX-apalooza! We are going to add two approaches that will allow you to apply RANKX across multiple columns. I went back and recreated the examples from the original post using the AdventureWorks Database as source material and have a zip with the examples in both a .xlsx and .pbix for you to use. You can download that zip here. I will not lengthen this post by rehashing all of the DAX from the first RANKX-apalooza, but you can revisit by following the link here.
RANKX Across Multiple Columns
What happens when we need to rank using multiple criteria? In the example below, we are going to look at resellers by name and key in a SalesTerritoryGroup, and we are going to rank them based on the number of items they have sold.
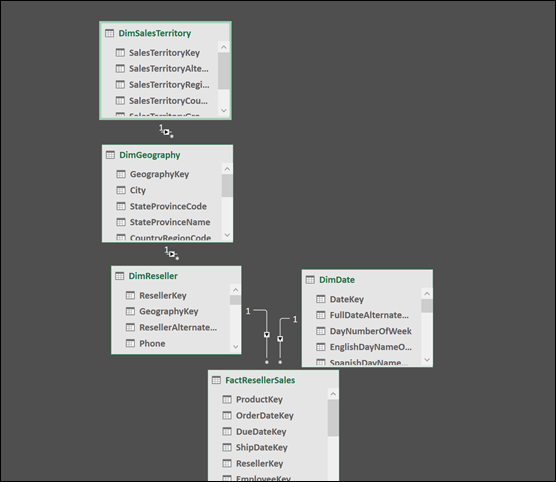
Let’s start with the model. I did slightly modify Rob’s original 3 table model approach. I now have 5 tables here, but the model conceptually still works the same. I have a sales table, a date table, a resellers table, and two lookup tables, one for geography and one for sales territory.
(Calendar Table still is Not Referenced in Any Formulas in Post)
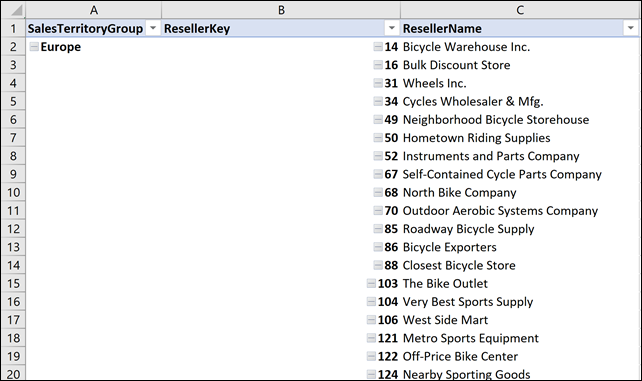
To stay true to the original RANKX-apalooza I’m going to work in Excel. Let’s start by inserting a pivot table. We want to drag SalesTerritoryGroup from the SalesTerritory table into rows and then we are going to add from the DimReseller table ResellerKey and ResellerName.
We now have a pivot table that looks like this:
Now let’s add our first measure:
[Units Sold] :=
SUM ( ‘FactResellerSales'[OrderQuantity] )
With this measure in place we can write our first RANKX measure:
[RANKX Multiple Columns 1] :=
IF (
HASONEVALUE ( DimReseller[ResellerKey] ),
RANKX (
CALCULATETABLE (
‘DimReseller’,
ALL ( DimReseller[ResellerKey] ),
ALL ( DimReseller[ResellerName] ),
ALL ( DimSalesTerritory[SalesTerritoryGroup] )
),
[Units Sold]
),
BLANK ()
)
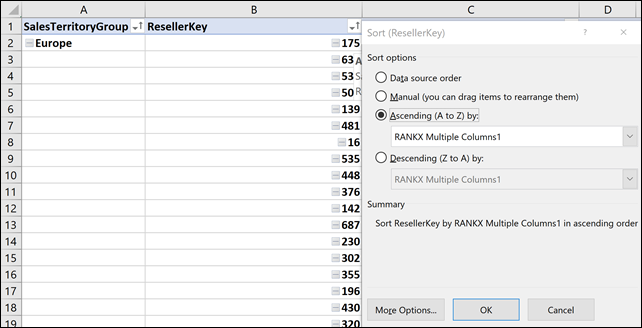
Let’s Sort by RANKX Multiple Columns 1:
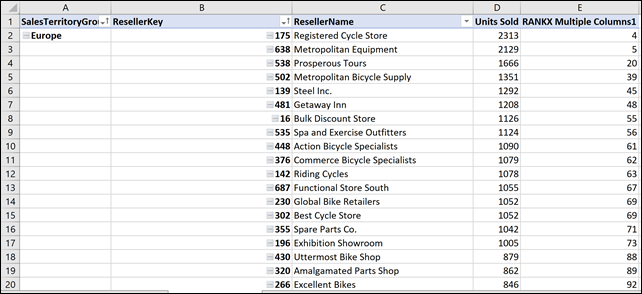
We now have a pivot table that looks like this:
This measure follows the same pattern as the original RANKX-apalooza but now uses CALCULATETABLE to create a virtual table that we use to capture more than one column for ranking. Using this measure allows us to rank all of the resellers against one another…but what if we want to see how they rank within their SalesTerritoryGroup? Let’s add RANKX Multiple Columns 2.
[RANKX Multiple Columns 2] :=
IF (
[Units Sold],
RANKX (
ALL ( DimReseller[ResellerKey], DimReseller[ResellerName] ),
[Units Sold]
),
BLANK ()
)
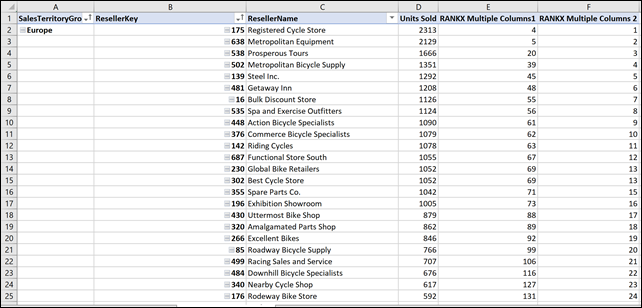
We now end up with a pivot table that looks like this:
By using ALL on ResellerKey and ResellerName, we leave the filter on SalesTerritoryGroup, and we achieve that Group ranking we were looking for.
Hopefully, this brief update adds some value to the original post by providing some examples to play with and expands upon the original pattern in a way that is useful!
Where It’s At: The Intersection of Biz, Human, and Tech*
We “give away” business-value-creating and escape-the-box-inspiring content like this article in part to show you that we’re not your average “tools” consulting firm. We’re sharp on the toolset for sure, but also on what makes businesses AND human beings “go.”
In three days’ time imagine what we can do for your bottom line. You should seriously consider finding out 🙂
* – unless, of course, you have two turntables and a microphone. We hear a lot of things are also located there.
